
Page 17 - 2516_ISLA_Market_Report_-_Sep_2025_v6
P. 17
16 17
Securities Lending Market Report | H1 2025
Equities
>>> EMEA Equities
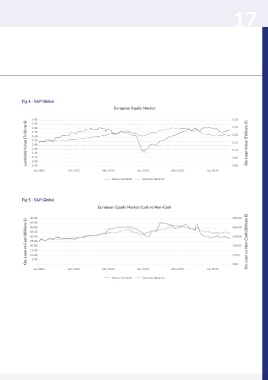
Europe as a region has been a beneficiary of the perceived volatility in the U.S. and demonstrated strength against the Fig 4 - S&P Global
headwinds of U.S. trade tariffs and economic uncertainty with a strong recovery off the back of the tariff related volatility in European Equity Market
April. There has been increased interest from the buyside partly due to the lower ECB rate allowing borrowers to enjoy interest
rates approximately 2% lower than that of their American counterparts. Coupled with positive sentiment, this contributed to
a market rally and increased utilization that saw on loan balances reach a high of €225bn before the market collapsed in April 4.00 0.30
3.90
due to the tariff uncertainty on a global scale. European equities started the year with around €155bn on loan and peaked at 3.80 0.25
just under €257bn and a utilization of 5.5% in the beginning of June, a 28% increase from a low of €200bn on loan in April. 3.70 0.20
Over the full period, European equities saw a 30% growth in on loan balances for H1 while the Stoxx600 was up only 6.7%. 3.60
3.50
The Stoxx600 increase this period was supported by banks In healthcare, Idorsia Limited (IDIA SW) a pharmaceutical Lendable Value (Trillions €) 3.40 0.15 On-Loan Value (Trillions €)
(SX7P) that was up 27.3%, utilities (SX6P) that were up 18.4% company restructured their convertible bond debt to free up 3.30 0.10
3.20
and finally construction materials (SXOP), Insurance (SXIP), CHF150mn of new funding in February this year, extending its 3.10 0.05
industrial goods and services (SXNP) and Telecoms (SXKP) up cash runway into 2026. Additionally, two of their new products 3.00
14.7%, 12.9% and 12.6% respectively. Conversely, Travel & QUVIVIQ and TRYVIO, an insomnia and hypertension drug 2.90 0.00
Leisure, Media, Healthcare, Autos, Consumer Products and respectively saw regulatory barriers lifted in the U.S. and Jan 2025 Feb 2025 Mar 2025 Apr 2025 May 2025 Jun 2025
Basic Resources exhibited declines between 2 and 8%. On approval for expansion into China, all contributing to a 302% Group Lendable On-Loan Balance
the back of the rally in the Telecoms sector, Eutelsat (ETL spike in share price from CHF0.71 to CHF2.15 on over the
FP) saw borrow levels averaging 17% and utilization holding first half of this year. IDIA SW remained well utilized over the
steady at 97%. At its peak, ETL FP surged to 35% borrow period with average fees of 73.74%. In terms of collateral
fee in June following a meteoric rise in the share price of preferences, non-cash collateral continues to be favored by Fig 5 - S&P Global
over 390% over the week of March 10, 2025, on news that the borrower community with non-cash balances averaging European Equity Market Cash vs Non-Cash
Eutelsat could potentially replace Elon Musk’s Starlink in 5x of cash balances. Our view is that this will continue as the
Ukraine due to souring relations between Ukraine and the lender community begins to broaden acceptable collateral sets 50.00 250.00
U.S. administration. BT Group (BT/A LN), the UK’s leading beyond the traditional G10 and main index equities. 45.00
provider of telecommunications started the year at GBP1.38 40.00 200.00
but increased 30% to GBP1.94 per share but continued to be 35.00
plagued by missed earnings numbers and weak international 30.00 150.00
sales and saw stable utilization but remained largely GC at On-Loan vs Cash (Billions €) 25.00 100.00 On-Loan vs Non-Cash (Billions €)
20.00
20bps due to depth of supply. 15.00 50.00
10.00
Top Market by Value On-Loan 5.00 - Feb 2025 Mar 2025 Apr 2025 May 2025 Jun 2025 0.00
Jan 2025
• UK €39bn • FR €27bn • IT €19bn • ES €10bn Group Lendable On-Loan Balance
• DE €29bn • CH €26bn • SE €19bn
Top Performing Names by Revenue
• IDIA SW €8mn, 57.5% utilisation, €21.6mn on loan, • RPI LN €2.9mn, 72,8% utilisation, €67.7mn on loan,
vwaf 7,374bps vwaf 862bps
• YUBICO SS €6.7mn, 93% utilisation, €113.9mn on loan; • BT/A LN €2.4mn, 47.5% util, €2.4bn on loan, vwaf 20bps
vwaf 1,168bps
• INTRUM SS €2.3mn, 60.4% util, €19.1mn on loan
• ETL FP €5.7mn, 88.2% utilisation, €82.4mn on loan, vwaf 2,422bps
vwaf 1,376bps
• GSF NO €2.3mn, 87.6% util, €66.3mn on loan, vwaf 685bps
• NB2 GR €3mn, 63.2% utilisation, €42.2mn on loan, • AML LN €2.3mn, 86.2% util, €89.6mn on loan, vwaf 506bps
vwaf 1,401bps
• ATS AV €2.2mn, 85.5% util, €30mn on loan, vwaf 1,466bps