
Page 12 - 2516_ISLA_Market_Report_-_Sep_2025_v6
P. 12
12 13
Securities Lending Market Report | H1 2025
>>> U.S. Treasury
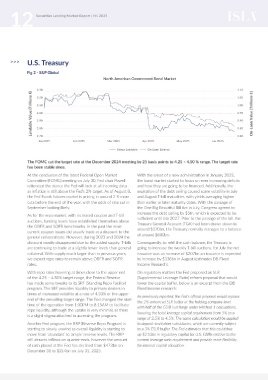
Fig 2 - S&P Global
North American Government Bond Market
3.30 1.10
Lendable Value (Trillions €) 3.10 1.00 On-Loan Value (Trillions €)
3.20
1.05
3.00
0.95
2.90
0.90
2.80
2.70
0.80
Jan 2025 Feb 2025 Mar 2025 Apr 2025 May 2025 Jun 2025 0.85
Group Lendable On-Loan Balance
The FOMC cut the target rate at the December 2024 meeting by 25 basis points to 4.25 – 4.50 % range. The target rate
has been stable since.
At the conclusion of the latest Federal Open Market With the onset of a new administration in January 2025,
Committee (FOMC) meeting on July 30, Fed chair Powell the bond market started to focus on ever increasing deficits
reiterated the stance the Fed will look at all incoming data and how they are going to be financed. Additionally, the
as inflation is still above the Fed’s 2% target. As of August 8, expiration of the debt ceiling caused some volatility in July
the Fed Funds futures market is pricing in around 2 ½ more and August T-bill maturities, with yields averaging higher
cuts before the end of the year, with the odds of rate cut in than earlier or later maturity dates. With the passage of
September looking likely. the One Big Beautiful Bill Act in July, Congress agreed to
increase the debt ceiling by $5tn, which is expected to be
As for the repo market, with increased coupon and T-bill sufficient until late 2027. Prior to the passage of the bill, the
auctions, funding levels have established themselves above Treasury General Account (TGA) had been drawn down to
the OBFR and SOFR benchmarks. In the past the most around $370bn, the Treasury normally manages to a balance
current coupon issues did usually trade at a discount to the of around $800bn.
general collateral rate. However, during 2023 and 2024 the
discount mostly disappeared due to the added supply. T-bills Consequently, to refill the cash balance, the Treasury is
are continuing to trade at a slightly lower levels than general going to increase the weekly T-bill auctions, for July the net
collateral. With supply much larger than in previous years, issuance was an increase of $207bn an issuance is expected
we expect repo rates to remain above OBFR and SOFR to increase by $338bn in August (estimates DB Fixed
rates. Income Research).
With repo rates hovering at times close to the upper end On regulatory matters the Fed proposed an SLR
of the 4.25 – 4.50% target range, the Federal Reserve (Supplemental Leverage Ratio) reform proposal that would
has made some tweaks to its SRF (Standing Repo Facility) lower the capital buffer, below is an excerpt from the DB
program. The SRF provides liquidity to primary dealers in Fixed Income research:
times of increased volatility at a rate of 4.50% or the upper As previously reported, the Fed’s official proposal would replace
end of the prevailing target range. The Fed changed the start the 2% enhanced SLR buffer at the holding company level
time of the operation from 1:00PM to 8:15AM to facilitate with half of the GSIB surcharge under Method 1 calculations,
repo liquidity, although the uptake is very minimal, as there lowering the total leverage capital requirement from 5% to a
is a slight stigma attached to accessing the program.
range of 3.5% to 4.5%. The same calculation would be applied
Another Fed program, the RRP (Reverse Repo Program) is to deposit-institution subsidiaries, which are currently subject
starting to slowly unwind as overall liquidity is starting to to a 3% ESLR buffer. The Fed estimates that this could free
move from ‘abundant’ to ‘ample’ reserve levels. The RRP up $210bn in regulatory capital for U.S. GSIBs relative to the
still attracts inflows on quarter-ends, however the amount current leverage ratio requirement and provide more flexibility
of cash placed at the Fed has declined from $473bn on for internal capital allocation.
December 31 to $214bn on July 31, 2025.