
Page 19 - 2516_ISLA_Market_Report_-_Sep_2025_v6
P. 19
18 19
Securities Lending Market Report | H1 2025
Equities
>>> U.S. Equities
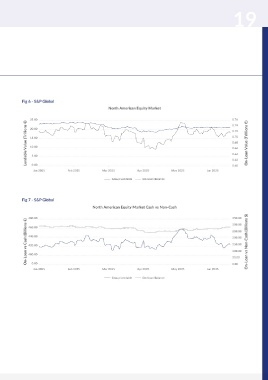
A very eventful year for U.S. equities securities lending thus far, driven by various macroeconomic factors, geopolitical Fig 6 - S&P Global
shifts, regulatory changes and ever evolving market sentiments. To further breakdown, the impact each had on U.S. Equities North American Equity Market
are following:
• Geopolitical conflicts and trade disputes introduce Overall, U.S. equities contributed to $650mn in revenues 25.00 0.76
uncertainty and fear into the global economic environment, with average fees reaching multi-month high of ~1.2% after 0.74
leading to increased stock market volatility. Investors react Coreweave Inv (CRWV) record a monthly VWAF of 1755 bps. 20.00 0.72
to perceived risks, potentially causing sharp price swings in Balances surged to an average for $655.8bn (highest level 15.00 0.70
equity markets. seen for many months). Lendable Value (Trillions €) 0.68 On-Loan Value (Trillions €)
• Global trade uncertainty and geopolitical conflicts can U.S. equity market was driven by outperforming corporate 10.00 0.66
disrupt global supply chains, leading to challenges such earnings, especially the Mag 7 which gained momentum after a 5.00 0.64
as transportation delays, higher freight costs, and even sluggish start at the beginning of the year, due to involvement 0.62
shortages of crucial materials. These disruptions can extend in AI. 0.00 0.60
production timelines, increase labor costs, and negatively While small cap continued to underperform with Russell 2000 Jan 2025 Feb 2025 Mar 2025 Apr 2025 May 2025 Jun 2025
impact corporate earnings across various industries, down 7.3% through June, small cap tech firms specially those
ultimately influencing stock prices. Group Lendable On-Loan Balance
involved in Quantum Computing saw good returns as they
• Increased costs from tariffs and supply chain disruptions trade specials (deeper fee) due to skepticism (RKT, QUBT, etc),
can fuel inflation. High inflation, particularly if it‘s surging, also reflecting investor concerns about higher interest rates
can put pressure on corporate profit margins and increase with greater financing needs. Fig 7 - S&P Global
market volatility, as companies grapple with raising prices or ADRs maintained their strong revenue performance, increasing North American Equity Market Cash vs Non-Cash
absorbing higher costs
131% YoY making June the second-best revenue month of the
• Imposing tariffs, particularly on key imported goods like year at $47mn. 350.00
clean energy technologies, can lead to increased costs for Through the months with increased balances, actively 300.00
U.S. companies. For example, U.S. manufacturers relying managed exchange-traded funds (ETFs) continue to 460.00 250.00
on foreign components for solar panels, wind turbines, and experience remarkable growth, due to combined benefits 440.00
batteries face higher import costs, impacting their profit of professional management with the structural advantages, On-Loan vs Cash (Billions €) 480.00 200.00 On-Loan vs Non-Cash (Billions $)
margins. 420.00 150.00
which include greater tax efficiency, lower expense ratios
• The clean energy sector, reliant on global supply chains compared to mutual funds, intraday liquidity, and improved 400.00 100.00
for components, is particularly vulnerable to the impact transparency. 50.00
of tariffs and trade tensions. Rising costs and policy 0.00 0.00
uncertainty can hinder new investments in renewable Jan 2025 Feb 2025 Mar 2025 Apr 2025 May 2025 Jun 2025
energy and related technologies, potentially impacting Group Lendable On-Loan Balance
the country‘s energy transition goals. For instance,
despite growth in domestic manufacturing, the U.S. still
heavily relies on imported solar panels, and increased
tariffs disproportionately affect imports from key supplier
countries.