
Page 10 - 2516_21_June_ISLA_Market_Report_-_June_2021_-_final
P. 10
10 11
Securities Lending Market Report | June 2021
Fixed Income
>>> Europe >>> US
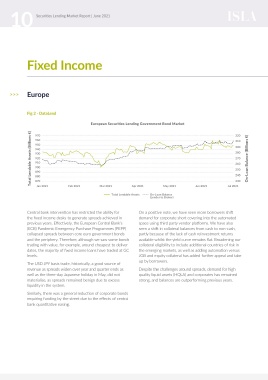
Fig 2 - DataLend Fig 3 - IHS Markit
European Securities Lending Government Bond Market 320 2.45 North American Securities Lending Government Bond Market 0.84
Total Lendable Assets (Billions €) 950 310 On-Loan Balance (Billions €) Total Lendable Assets (Trillions €) 2.35 0.82 On-Loan Balance (Trillions €)
970
2.40
960
300
2.30
940
0.80
2.25
280
930
2.20
0.78
920
270
2.15
910
2.10
260
0.76
900
2.05
250
2.00
890
0.74
240
1.95
880
0.72
870
230
May 2021
Jan 2021
May 2021
Jan 2021
Feb 2021
Apr 2021
Mar 2021
Total Lendable Assets
Total Lendable Assets On-Loan Balance Jun 2021 Jul 2021 1.90 Feb 2021 Mar 2021 Apr 2021 On-Loan Balance Jun 2021 Jul 2021
(Lender to Broker)
Central bank intervention has restricted the ability for On a positive note, we have seen more borrowers shift The theme for the first half of 2021 was the continuation Cash market yields rose violently at the start of 2021 and
the fixed income desks to generate spreads achieved in demand for corporate short covering into the automated of global central banks providing unprecedented easy continued throughout the quarter as vaccine distribution
previous years. Effectively, the European Central Bank’s space using third party vendor platforms. We have also monetary policy to markets outside of war efforts. In the improved and states began to reopen. The 10-year note
(ECB) Pandemic Emergency Purchase Programmes (PEPP) seen a shift in collateral balances from cash to non-cash, US, the Federal Reserve dropped interest rates to zero in yield peaked at 1.74% at the end of March rising from
collapsed spreads between core euro government bonds partly because of the lack of cash reinvestment returns March 2020 and began yet another quantitative easing 0.90% in January. The belly of the curve rose in lockstep -
and the periphery. Therefore, although we saw some bonds available whilst the yield curve remains flat. Broadening our programme for US$120 billion per month in order to the five-year note markedly peaking at 0.94% from 0.35%
trading with value, for example, around cheapest to deliver collateral eligibility to include additional countries of risk in ensure confidence and liquidity. The US Federal Reserve at the start of the year. This period was very strong for US
dates, the majority of fixed income loans have traded at GC the emerging markets, as well as adding automation versus crossed red lines to purchase assets, including corporates Treasury shorts across the yield curve despite the increased
levels. JGB and equity collateral has added further appeal and take and municipals, outside their given mandate to signal that coupon issuance. The long end began its current rally
up by borrowers. any necessary action would be taken to prevent economic at the end of May as the COVID-19 Delta variant made
The USD JPY basis trade, historically, a good source of
revenue as spreads widen over year and quarter ends as Despite the challenges around spreads, demand for high disaster from COVID-19. headlines and accelerated when the price action became
well as the three-day Japanese holiday in May, did not quality liquid assets (HQLA) and corporates has remained Easy monetary policy was met with equally easy fiscal the story.
materialise, as spreads remained benign due to excess strong, and balances are outperforming previous years. policy - putting liquidity directly into the bank accounts GC began grinding toward zero percent in February,
liquidity in the system. of citizens. Cash and equivalents increased by orders of where it remained until the Federal Reserve hiked both
magnitude again not seen outside of a war effort. This the interest rate on excess reserves (IOER) and the reverse
Similarly, there was a general reduction of corporate bonds liquidity was raised and maintained by issuing T-Bills and repurchase (RRP) facility at the June Federal Open Market
requiring funding by the street due to the effects of central cash in the Treasury’s General Account distributed through Committee (FOMC). As reserves rose to the highs, demand
bank quantitative easing.
fiscal channels as new programmes were approved by the for positive yielding assets was greater than supply, which
US Congress. These actions have proven beneficial to risk forced cash into the Federal Reverse Repo facility at a zero
assets and employment has improved. Nonfarm payroll percent rate. GC responded immediately and moved away
numbers increased significantly every month with a slight from zero. When the Treasury General Account decreased
hiccup in April when economists were expecting over one as fiscal stimulus was distributed, RRP usage increased in
million jobs gained but only printed 266 thousand. Inflation kind and reached a peak just under US$1 trillion on 30
risk was inevitable and appeared in earnest when the April June 2021. RRP usage is expected to remain elevated as
consumer price index jumped 0.90% month over month, a the US Congress debates the debt ceiling limit set to expire
number not seen since the early 1980s. on 31 July 2021.