Page 10 - 2516_21_June_ISLA_Market_Report_-_March_2022_final
P. 10

10                                                                                                                                                                                                                        11

                 Securities Lending Market Report | March 2022


             Fixed Income


             HQLA


             As expected, we saw increased supply within the global government bond market in 2021.
             Excess liquidity from quantitative easing across developed   There was a general reduction of cross-currency spreads,
             markets continued to hit new highs, suppressing curves and   as central bank policy became synchronised globally and
             also leading to collateral shortages. With record deposit   risk appetite away from the security of the US dollar was
             levels, banks became liability constrained. This problem   reinvigorated.
             was most obvious in the US, where the overnight reverse   After an initial sell-off, yield curves remained flat for the
             repurchase facility hit an all-time high of $1.9 trillion on   majority of 2021, offering limited reinvestment opportunity,
             31 December, as excessive cash and reduced collateral   although curves became fractured into Q4 as central banks
             availability supressed international discount margin rates.   signalled imminent tapering and expectations of interest rate
                                                              rises intensified.


     >>>     Europe                                                                                                          >>>    US


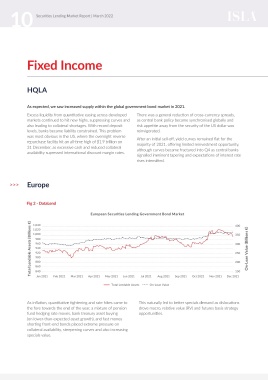
             Fig 2 - DataLend                                                                                                       Fig 3 - IHS Markit
                                         European Securities Lending Government Bond Market              400                            3.00                    North American Securities Lending Government Bond Market         0.95

               Total Lendable Assets (Billions €)  1,000                                                 350   On-Loan Value (Billions €)  Total Lendable Assets (Trillions €)  2.50                                             0.90  On-Loan Value (Trillions €)
                1,040
                1,020

                 980
                                                                                                                                                                                                                                 0.85
                                                                                                                                        2.00
                 960
                                                                                                         300
                                                                                                                                        1.50
                                                                                                                                                                                                                                 0.80
                 940
                 920
                                                                                                         250
                                                                                                                                                                                                                                 0.75
                                                                                                                                        1.00
                 900
                 880
                                                                                                         200
                                                                                                                                        .50
                                                                                                                                                                                                                                 0.70
                 860
                                                                                                                                                                                                                                 0.65
                                                                                                                                          -
                                                                                                         150
                 840
                                                                                                                                                                               Jun 2021
                                                                                                                                                                       May 2021
                 Jan 2021
                         Feb 2021
                                Mar 2021
                                                                       Aug 2021
                                                        Jun 2021
                                                May 2021
                                        Apr 2021
                                                                                                                                                                                        On-Loan Balance
                                                  Total Lendable Assets  Jul 2021 On-Loan Value  Sep 2021  Oct 2021  Nov 2021  Dec 2021  Jan 2021  Feb 2021  Mar 2021  Apr 2021 Total Lendable Assets  Jul 2021  Aug 2021  Sep 2021  Oct 2021  Nov 2021  Dec 2021
             As inflation, quantitative tightening and rate hikes came to   This naturally led to better specials demand as dislocations   In the US, the ongoing impact of the global pandemic   shifted to rising inflation, the front end of the curve started
             the fore towards the end of the year, a mixture of pension   drove macro, relative value (RV) and futures basis strategy   appears to have had a significant impact on yield curves,   to sell aggressively, dropping on economic and central
             fund hedging rate moves, bank treasury asset buying   opportunities.                                                   which remained relatively muted and flat through 2021.   bank expectations. These curve movements coincided with
             (on lower-than-expected asset growth), and fast money                                                                  The year started with the vaccine rollout, which caused   specials opportunities for most agent lenders.
             shorting front-end bonds placed extreme pressure on                                                                    a sharp sell-off in the 5-30 sector United States Treasury
             collateral availability, steepening curves and also increasing                                                         bonds (USTs) and sent the yield curve steeper, particularly
             specials value.
                                                                                                                                    through 10-year. However, as the year elapsed and focus
   5   6   7   8   9   10   11   12   13   14   15